


🏡 The 2022 Housing Market In 5 Charts
It's more complicated than you think.

What’s going on in the US housing market?
These 5 charts will tell you all you need to know…
1. The US Housing Market Is Slowing Down

There are 25% more homes for sale than a year ago.
Inventory is growing even faster in Austin, Boise & Phoenix.
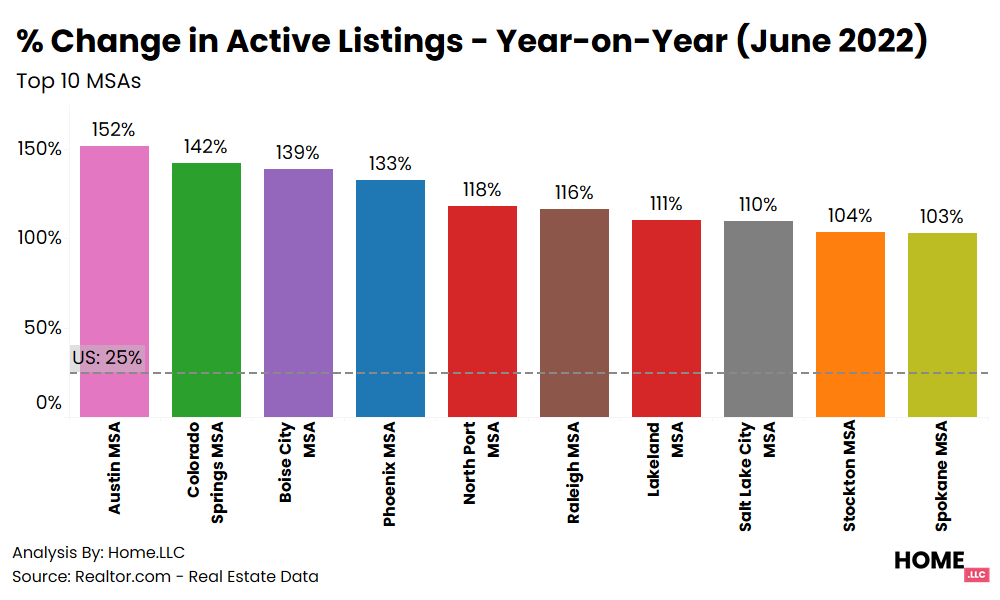
This isn’t the only indication that the market is slowing down.
2. More Sellers Are Taking Price Cuts
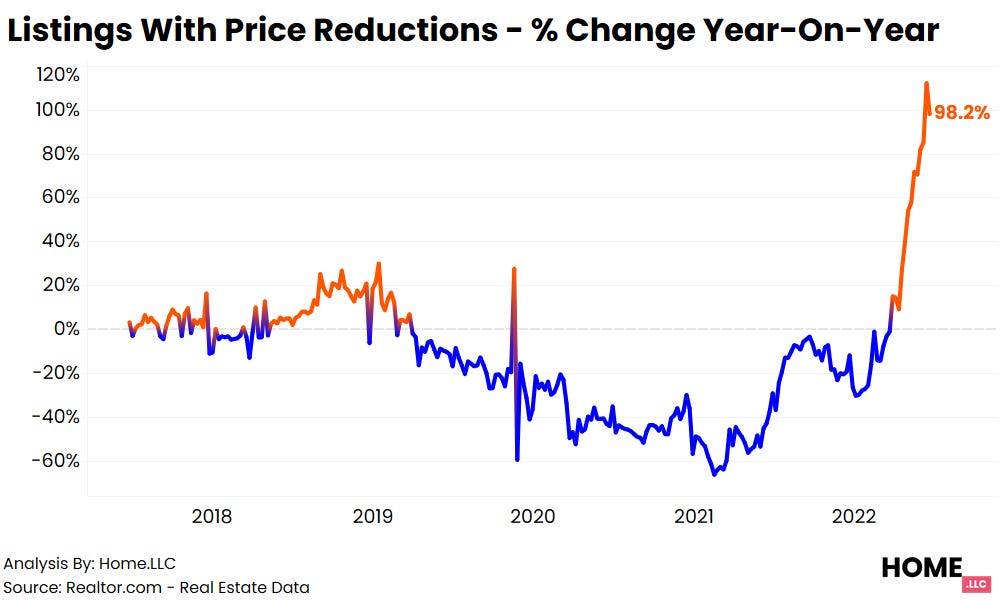
98% more sellers have reduced the price of their home in order to sell it.
The housing affordability crisis is to blame.
3. The Housing Affordability Gap Is The Highest On Record

The median American household can afford a home worth $377K. The median priced US home costs $447K.
This affordability gap of $69K is the highest on record. That’s why home buyers are taking a step back.
So are we headed for a housing crash?
Not any time soon.
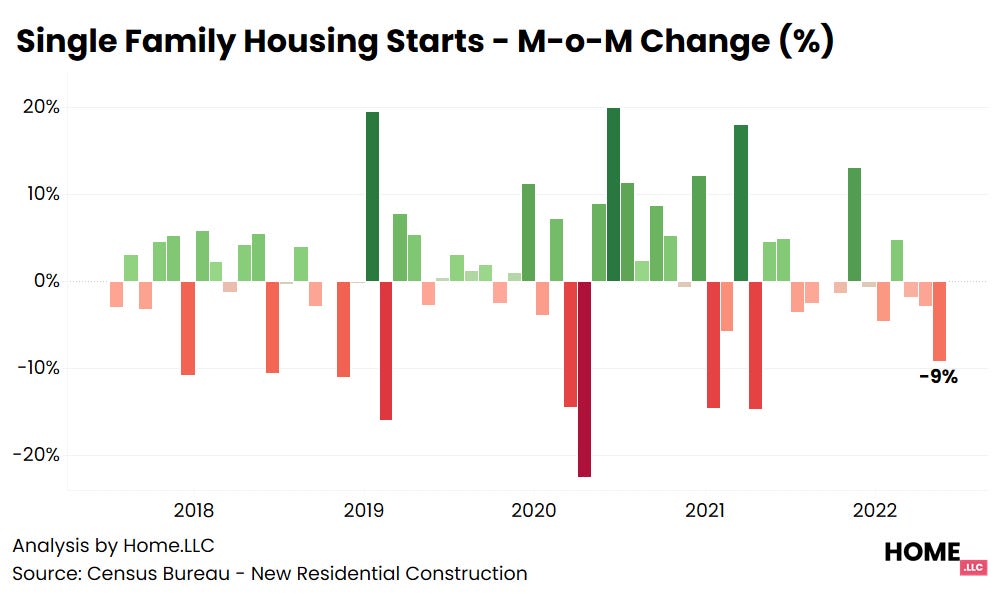
4. Housing Supply Is Starting To Moderate
Here’s why US home prices are unlikely to crash:
Resale inventory could actually worsen: 90% of mortgage holders are locked in at rates <5%. Most won’t sell their homes while rates are >6%.
Builders are breaking ground on fewer units: Housing starts have gone down in 5 of the last 6 months, in response to rising rates & slowing demand.
5. But Some Cities Are Riskier Than Others
Home prices are unlikely to crash nationally, but cities with slowing demand and rising supply are at risk of a correction in prices.
We analyze this in detail here.

Meanwhile…our investments are yielding 20% IRR
Despite deep corrections in stocks & crypto
Despite rising interest rates & sky-high inflation
Despite rising rumors of a hard landing
Send me a note if you’d like to invest with us!
Note: All statements above are subject to revisions based on changing assumptions and market conditions. Figures could be rounded by +-10% for improving readability. Hoom Inc is neither a tax advisor nor a financial advisor and none of our statements should be interpreted as tax or financial advice.